



Vision Suite Ultimate by Software Athlete
Custom symbols, reporting and audit tools for AVEVA PI Vision
Turn PI Vision into your operational intelligence workspace. Build interactive dashboards, capture operator input, automate reports and protect critical displays in the PI Vision environment your team already uses.
Trusted by global industry leaders


What is Vision Suite Ultimate for AVEVA PI Vision?
Vision Suite Ultimate is a set of add-ons for AVEVA PI Vision from Software Athlete. It extends the PI Vision environment you already run with custom symbols, automated reporting and display audit and recovery.
Your team keeps working in PI Vision, with the same PI System data and displays. There is no separate dashboard platform to introduce.
- What are PI Vision custom symbols?
- Custom symbols are additional visual components that you place on PI Vision displays alongside the native symbols. They are built with JavaScript and HTML using the PI Vision extensibility model. Vision Library+ adds 40+ custom symbols for advanced charts, Event Frame analysis, manual data entry, tables and navigation. Browse the PI Vision symbol directory
- How does PI Vision reporting work?
- Vision Report+ turns existing PI Vision displays into PDF or image reports. Reports run on a schedule or an event trigger and can be emailed, printed or stored, so shift and production reports no longer depend on manual screenshots.
- How are PI Vision displays audited and recovered?
- Vision Audit+ records who changed which display and when, keeps earlier versions for rollback, recovers deleted displays and tracks validation status for controlled environments.
What’s included in Vision Suite Ultimate
Three extensions for AVEVA PI Vision with one goal: make the displays your team already uses more useful, easier to share and safer to change.
-
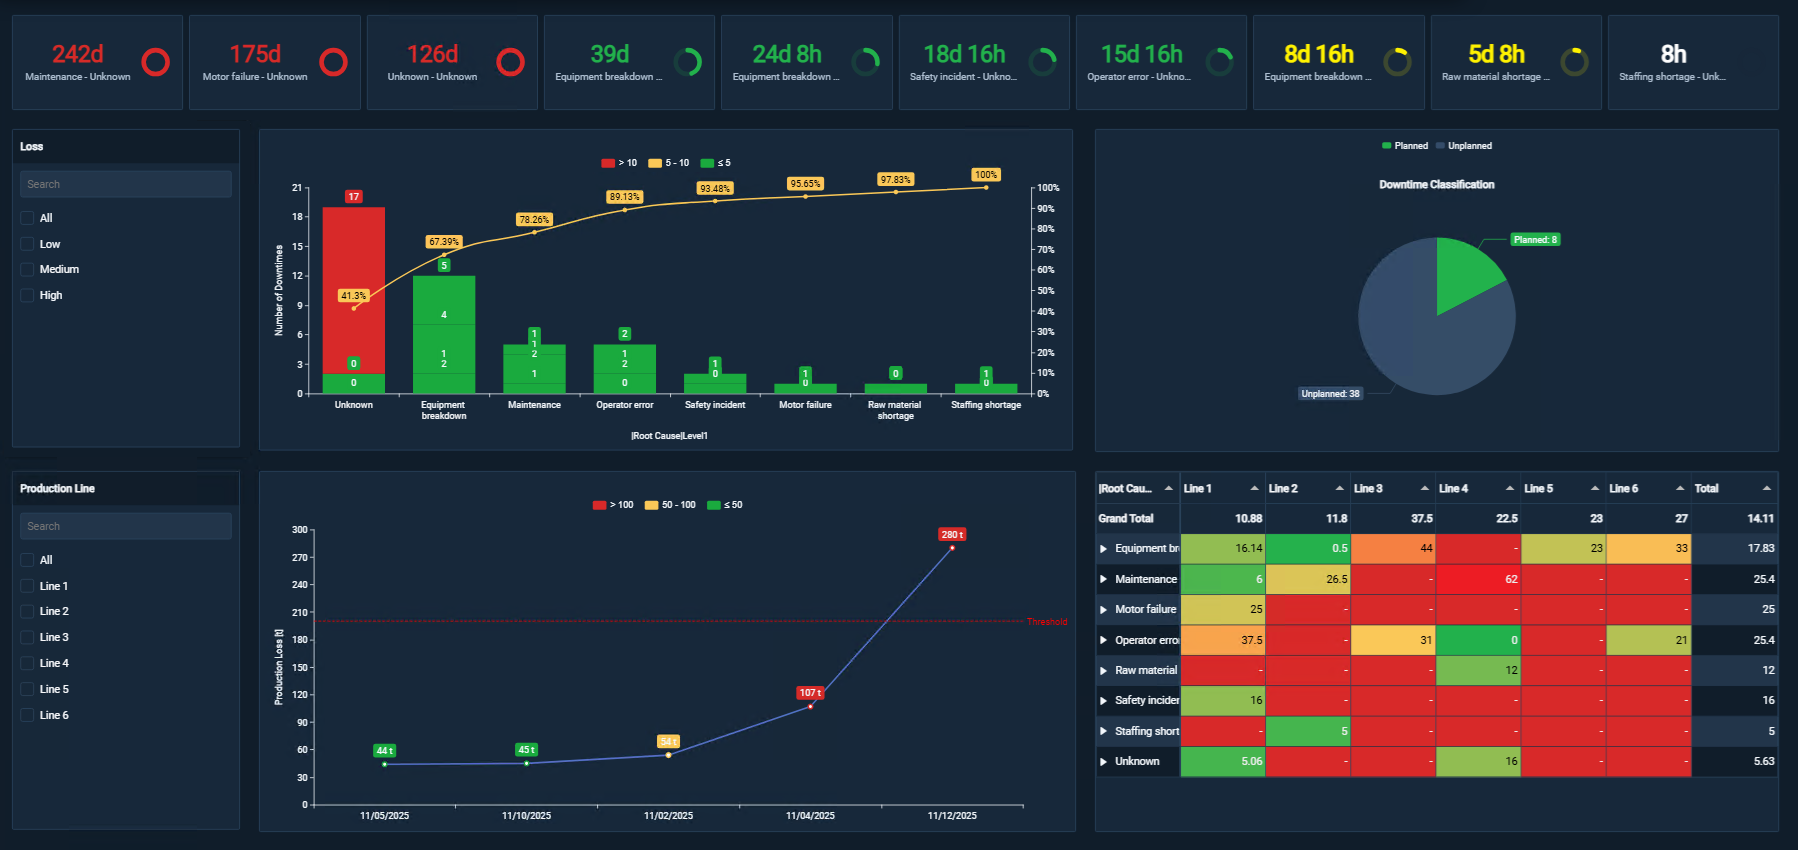
Vision Library+
49 custom symbols for the PI Vision display editor.
- Advanced charts, KPI cards and gauges
- Event Frame tables, Gantt charts and analytics
- Manual data entry and operator input
- Navigation, asset selection and filters
-
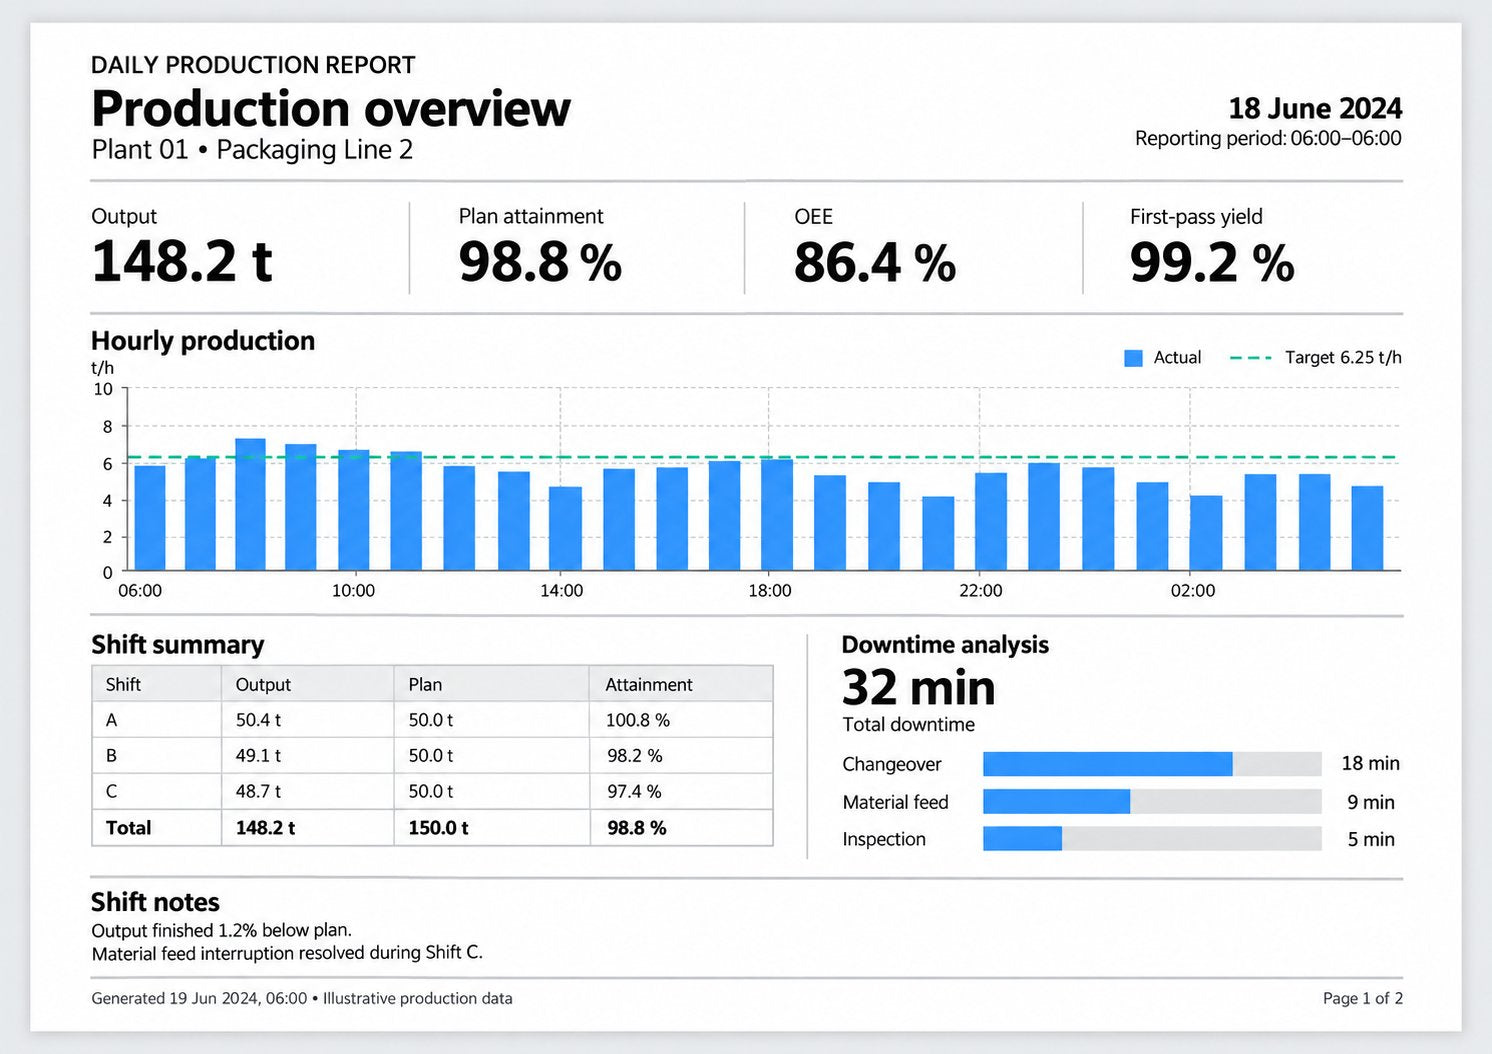
Vision Report+
Turns PI Vision displays into PDF, Excel and image reports.
- On a schedule, or when an Event Frame starts or ends
- Delivered by email, Teams, printer or shared folder
- Optional approval before reports go out
- Excel export of Vision Library+ tables
-
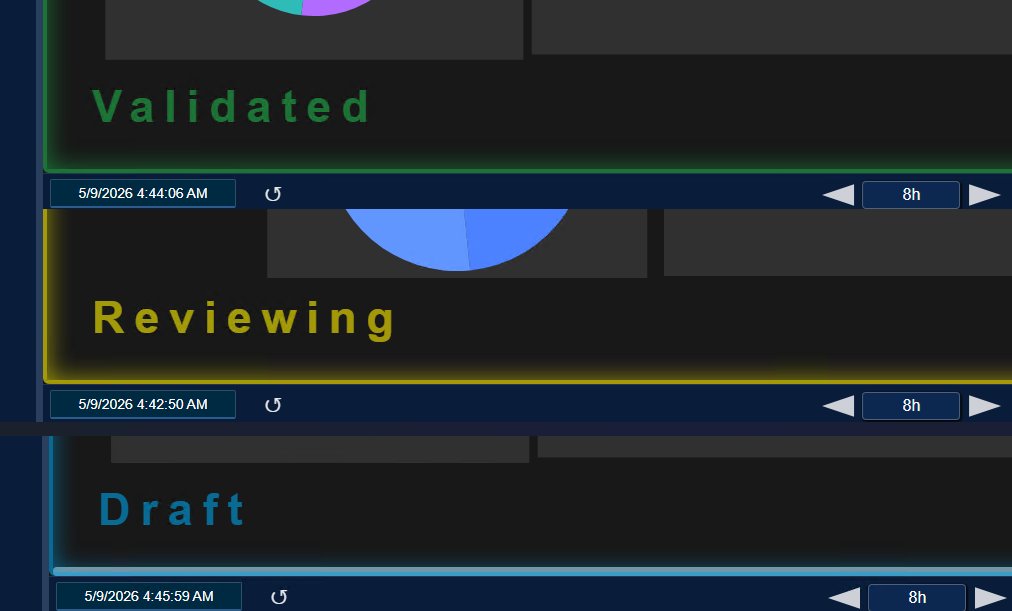
Vision Audit+
Keeps a full history of every PI Vision display.
- Who changed what, when and why
- One-click rollback and a recycle bin for deleted displays
- Review and approval, with validated displays locked
- Status watermark on every display
PI Vision custom symbols included
Charts 13
Event Frames 10
Assets 8
Navigation & Utility 5
Values & Status 6
Tables 3
See what your next PI Vision dashboard could look like
Explore production, downtime, Event Frames, data entry and shift handover.

Choose your Vision Suite edition
Start with the custom symbols, or add reporting and change control. Every edition runs in the PI Vision environment you already have.
-
Vision Library+
Includes Vision Library+
Best for richer dashboards and operator input.
- 49 custom symbols
- Charts, KPI cards and gauges
- Event Frame analysis and data entry
- Tables, navigation and display controls
- Most popular
Vision Suite Essential
Includes Vision Library+ and Vision Report+
Best for teams that need dashboards and automated reporting.
- Everything in Vision Library+
- Scheduled and Event Frame-triggered reports
- PDF, Excel and image output
- Email, Teams, print and report archive
-
Vision Suite Ultimate
Includes Vision Library+, Vision Report+ and Vision Audit+
Best for teams that also need change control and validation.
- Everything in Vision Suite Essential
- Display history, rollback and recycle bin
- Draft, In Review and Validated workflow with locking
- Supports GxP and other regulated procedures
Vision Report+ and Vision Audit+ are also available on their own. Ask us for a quote.
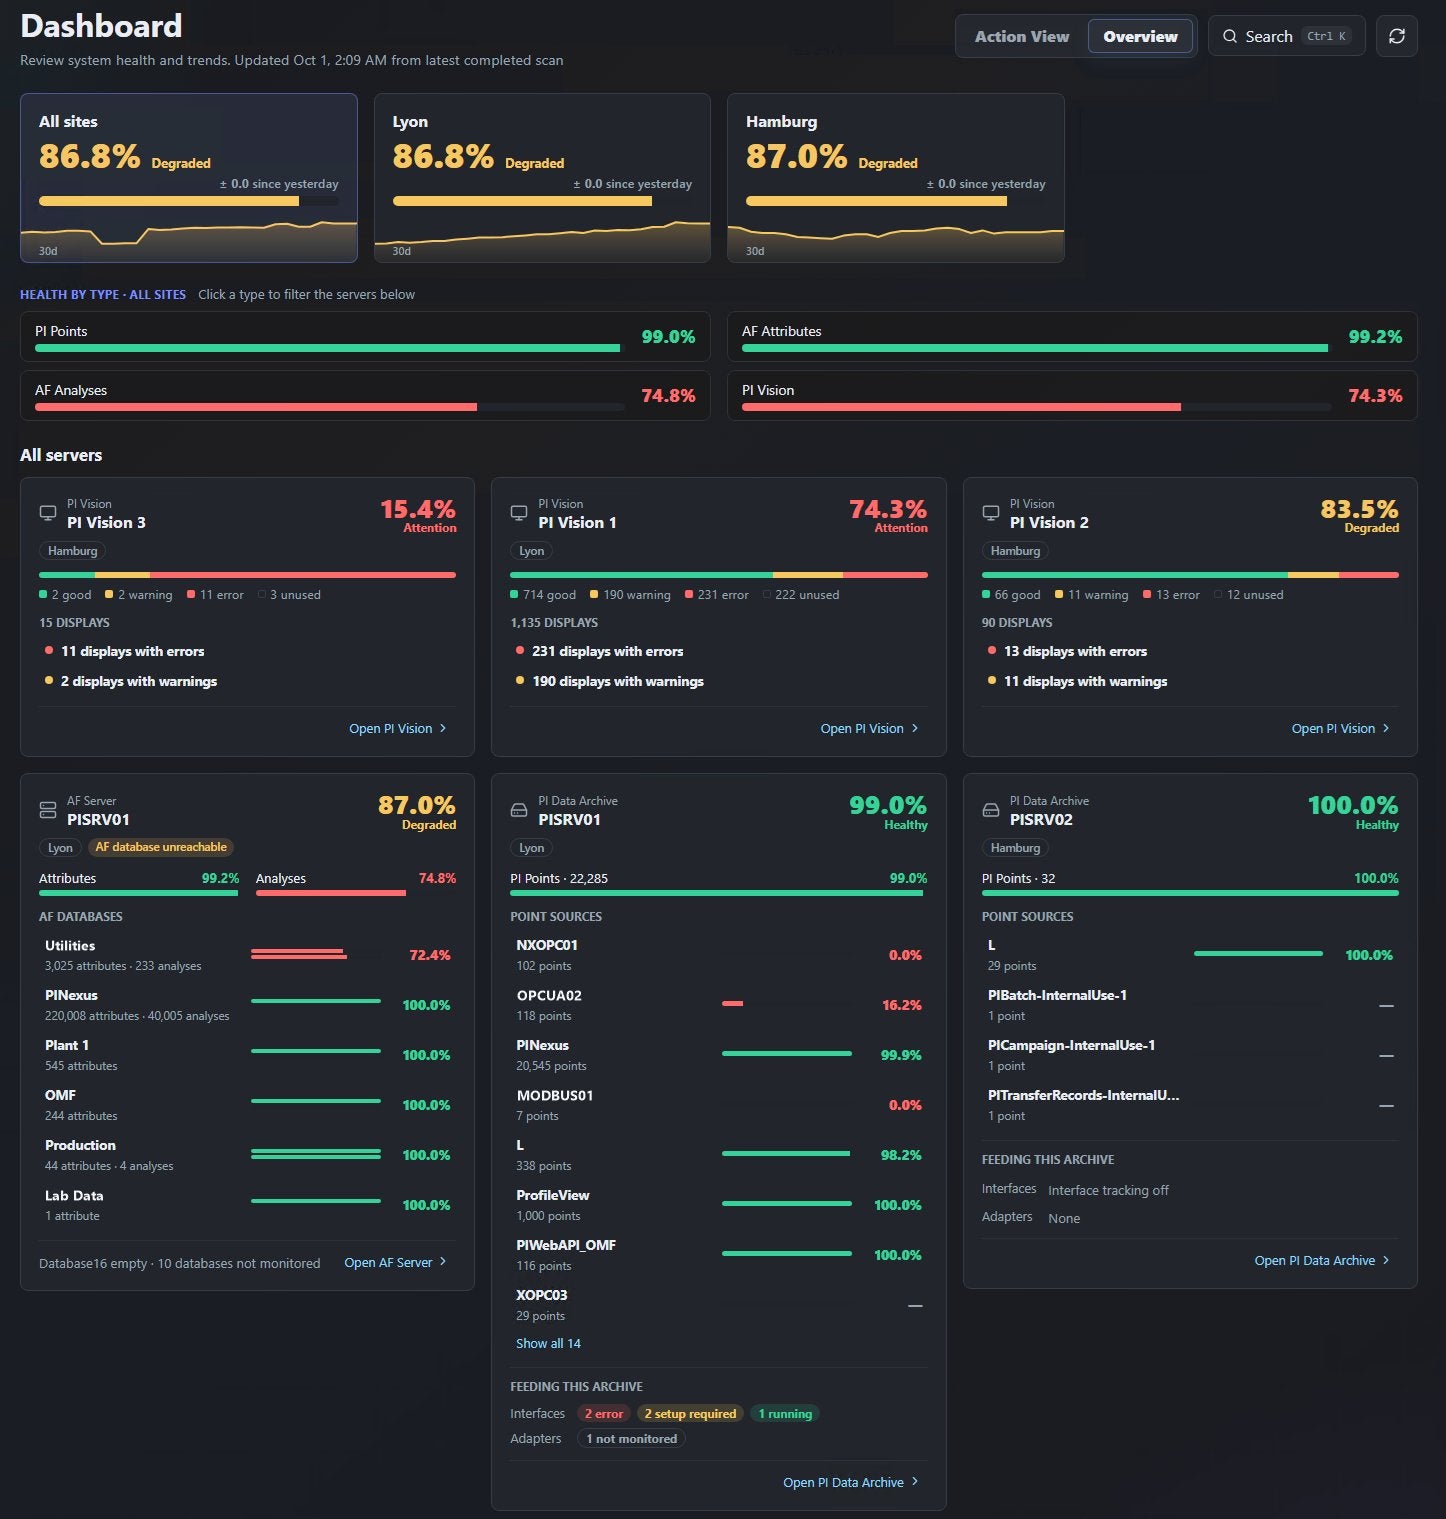
PI Nexus+ for PI System health monitoring
Monitor your PI servers, interfaces and data, and see what a problem affects.
- Monitor servers and sites. Health scores for your PI Data Archive, AF and PI Vision servers, per site.
- Watch your interfaces. Follow PI Interface runtime and get an email when an interface degrades or recovers.
- Catch bad data early. Frequent health checks flag stale, bad or frozen PI Point values and failing AF analyses.
- Trace the impact. See which AF objects, analyses and PI Vision displays depend on the affected data.
Vision Suite FAQ
Questions we are asked most often about the suite and its editions.
What is Vision Suite Ultimate?
A package of three Software Athlete extensions for AVEVA PI Vision: Vision Library+ (custom symbols), Vision Report+ (automated reports) and Vision Audit+ (display history, recovery and validation). Your team keeps working in PI Vision with your existing PI System data.
What is the difference between Vision Suite Essential and Vision Suite Ultimate?
Vision Suite Essential includes Vision Library+ and Vision Report+. Vision Suite Ultimate adds Vision Audit+ for display history, rollback, recovery of deleted displays and the validation workflow.
Can we buy the products separately?
Yes. Vision Library+, Vision Report+ and Vision Audit+ are each available on their own. The suites combine them in one package.
Do we need a separate dashboard or reporting platform?
No. All three products extend PI Vision. Dashboards, reports and display history stay in your PI Vision environment and use your existing PI System data.
What do we need to run it?
AVEVA PI Vision 2021 or later. Vision Report+ and Vision Audit+ also use PI Web API and PI AF, and run as services on a Windows server in your environment. We go through the details for your setup before the trial.
Is a trial available?
Yes. Request a trial for your own PI Vision environment. We confirm compatibility and your trial license details, then email the evaluation instructions.
Try Vision Suite Ultimate in your PI Vision environment
Show us your dashboard, reporting or display-management task. We’ll walk through the relevant tools, or help you get started with a trial.
Latest Updates
Product releases, new capabilities and practical improvements.

Vision Library+ v2.1: XY Plot+, Control Chart+ and Event Analytics Table+
Vision Library+ 2.1 adds three new symbols: XY Plot+, Control Chart+ and Event Analytics Table+. Charts can now show values...

PI Nexus+ v1.7: host monitoring, a Monitoring page and sites
PI Nexus+ v1.7 watches the servers your PI System runs on, not only the PI data. Agentless host monitoring, a...

PI Nexus+ v1.6: live interface monitoring, health scans and recalculation
PI Nexus+ v1.6 brings PI Interface scanning, live interface monitoring and frequent health checks together for ongoing PI System monitoring....


