Asset Comparison Bar Chart+
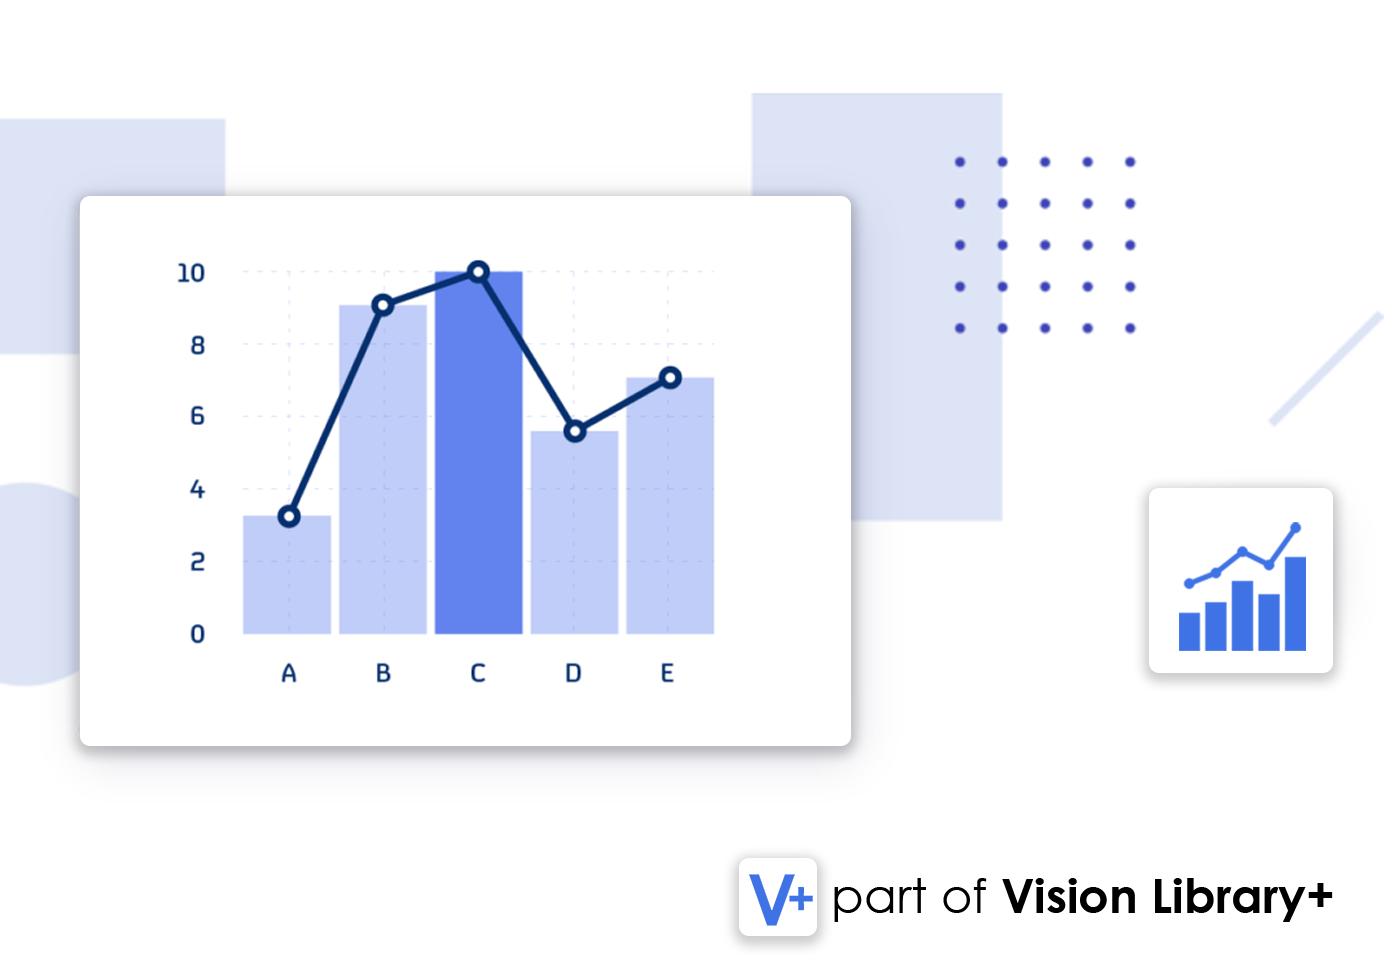
Asset Comparison Bar Chart+ is a custom symbol for PI Vision that allows you to visualize and compare data of different assets in a bar chart. This versatile symbol is part of the Vision Library+ Symbol Package.
Features
- Asset Comparison: Compare data of different Assets to each other
- Dynamic Search Criteria: Dynamically filter assets by customizing the asset search criteria.
- Stacking: Create normal and 100% stacked bar charts.
- Multistate Visualization: Use multistate features to highlight key thresholds or limits.
- Top Calculation: Show the Top N assets (for example, top ten best performing assets).
- Orientation: Choose between horizontal and vertical orientation.
- Axes: Configure Multiple X and Y Axes
Benefits
- Improved Visualization: Compared to the default Asset Comparison Table, this symbol is much easier to read and looks more modern
Example Use Cases
- Production Monitoring: Compare actual vs. projected production values in real-time.
- Resource Allocation: Visualize resource usage trends with combined metrics.
- Quality Assurance: Analyze performance metrics against established benchmarks.
Screenshots

Compare Assets
Compare data of multiple assets in a single chart.

Multiple Attributes
Supports comparing multiple attributes of different assets.

Stacked Bar Charts
Create stacked bar charts by combining multiple attributes together.

Horizontal Alignment
Align the chart horizontally or vertically.

Switch Series
Switch your categories to show either Assets or Attributes

Fully customizable
Customize everything

Top N Calculation
Show only the top 10 assets meeting a certain condition

100% Stacked Bar
Create a 100% stacked bar chart
Demo
Questions?
Click the button below to get in contact, or simply email us at contact@software-athlete.com. We would love to help you.


