Elevate your PI Vision dashboards with these essential custom symbols that enhance functionality and user experience.
AVEVA PI Vision is a powerful tool for visualizing real-time data from the PI System. While it offers a robust set of standard symbols and features, the platform's true potential is unlocked when you incorporate custom symbol extensions. These extensions allow you to tailor your dashboards to meet specific operational needs, improve data interpretation, and streamline workflows.
In this blog post, we'll introduce you to five top custom symbol extensions from Vision Library+ that every PI Vision user should be aware of. These tools can transform your data visualization and make your dashboards more interactive and user-friendly.
1. Manual Data Entry
Empower your team to input data directly into the PI System from within PI Vision.

Key Features:
- Direct Data Input: Allows users to manually enter or adjust data points directly on the PI Vision display.
- Real-Time Updates: Inputs are immediately reflected in the PI System, ensuring data is up-to-date.
- Access Control: Supports user authentication to ensure only authorized personnel can modify data.
Benefits:
The Manual Data Entry symbol is invaluable for scenarios where automatic data collection isn't possible or when supplementary data needs to be added. Whether it's entering laboratory results, manual readings, or operator comments, this symbol streamlines the process by eliminating the need for external data entry systems. It enhances data accuracy and saves time by integrating manual inputs seamlessly into your existing data streams.
2. Combo Chart
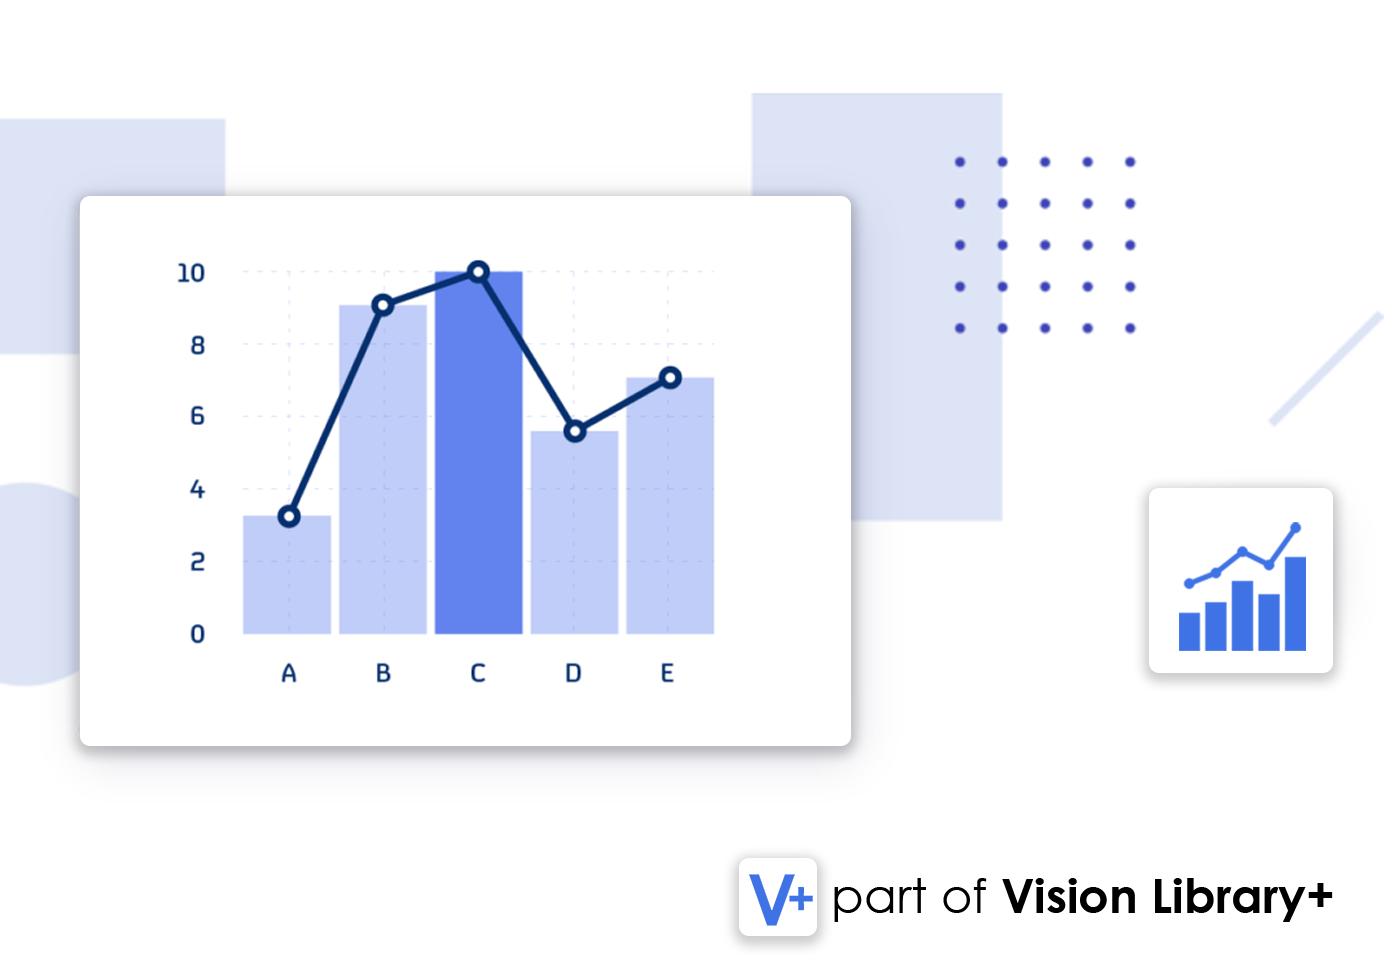
Visualize multiple data sets with a versatile chart that supports various chart types in one.

Key Features:
- Multiple Chart Types: Combines area, scatter, line, bar charts, and more into a single, cohesive display.
- Dual Axis Support: Plot different variables with separate axes to compare disparate data sets effectively.
- Interactive Elements: Features zooming, panning, and tooltips for an engaging data exploration experience.
Benefits:
The Combo Chart symbol offers a dynamic way to visualize complex data relationships. By accommodating multiple chart types, it enables users to compare trends, correlations, and patterns within a single visual context. This is particularly useful for monitoring KPIs across different units or processes, providing a holistic view that standard charts can't offer.
3. AF Table
Integrate and display Asset Framework tables and SQL database information directly in your dashboards.

Key Features:
- Data Integration: Fetches data from AF tables and SQL databases to display in a structured table format.
- Customizable Views: Offers sorting, filtering, and conditional formatting to highlight critical information.
- Real-Time Syncing: Ensures that the displayed data is always current with automatic updates.
Benefits:
The AF Table symbol bridges the gap between your PI System data and relational databases. It allows you to present configuration data, reference tables, or any tabular information alongside your real-time data. This integration enriches your dashboards, enabling more informed decision-making by providing context that wouldn't be available through standard symbols alone.
4. Alarm Sound
Enhance your alert system with audible notifications for critical events.

Key Features:
- Audible Alerts: Plays sound notifications when specific conditions or thresholds are met.
- Customizable Settings: Choose different sounds and set volume levels to differentiate between types of alerts.
- Persistent Notifications: Configurable options to repeat sounds until the alarm is acknowledged.
Benefits:
The Alarm Sound symbol adds an essential layer of awareness for monitoring critical processes. In environments where visual alerts might be missed due to screen clutter or operator multitasking, audible alarms ensure that important events receive immediate attention. This can significantly reduce response times to critical situations, enhancing safety and operational efficiency.
5. Navigation Menu
Improve user navigation with a customizable, web-like menu system within PI Vision.

Key Features:
- Hierarchical Structure: Organize your displays and dashboards into an expandable menu for easy access.
- Intuitive Design: Mimics familiar web navigation patterns, reducing the learning curve for new users.
- Custom Links: Include shortcuts to external resources, documents, or other PI Vision displays.
Benefits:
The Navigation Menu symbol streamlines the user experience by simplifying movement between different parts of your PI Vision environment. It reduces the time and effort required to locate specific dashboards or data displays, thereby increasing productivity. This is especially beneficial in large-scale deployments where users need quick access to a multitude of displays.
Conclusion
Incorporating these custom symbol extensions from Vision Library+ into your PI Vision dashboards can significantly enhance both functionality and user engagement. They address common challenges such as data input, complex data visualization, data integration, alert management, and user navigation. By tailoring your PI Vision environment with these tools, you can optimize your data monitoring and analysis, leading to better operational decisions. For a full list of all custom symbols included in PI Vision, see here.
Get Started Today
Interested in implementing these custom symbols in your PI Vision system? Contact us to learn more about how these extensions can benefit your operations. Our team of experts is ready to assist you in enhancing your data visualization capabilities.
Stay tuned for more insights and tips on maximizing your PI Vision experience. Subscribe to our newsletter to keep up with the latest updates and best practices.


