Symbols in Development
The following symbols are currently under development and will be released with the next major update of Vision Library+.
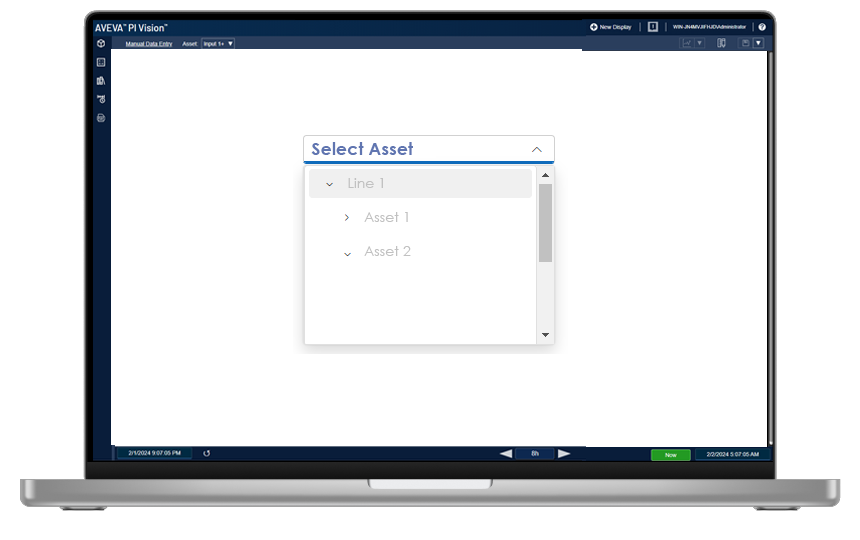
Asset Select
Select your display asset from a dropdown menu list, that supports a tree structure.
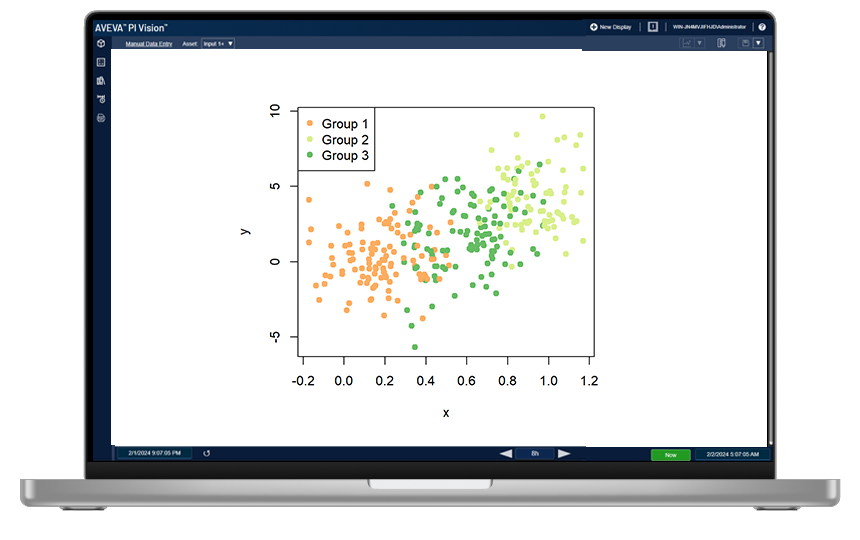
XY Plot
Improved XY-Plot control, add a third dimension for coloring, select data points & more.
Planned Symbols
The following symbols are currently planned for a future release of Vision Library+, or were requested from our customers.
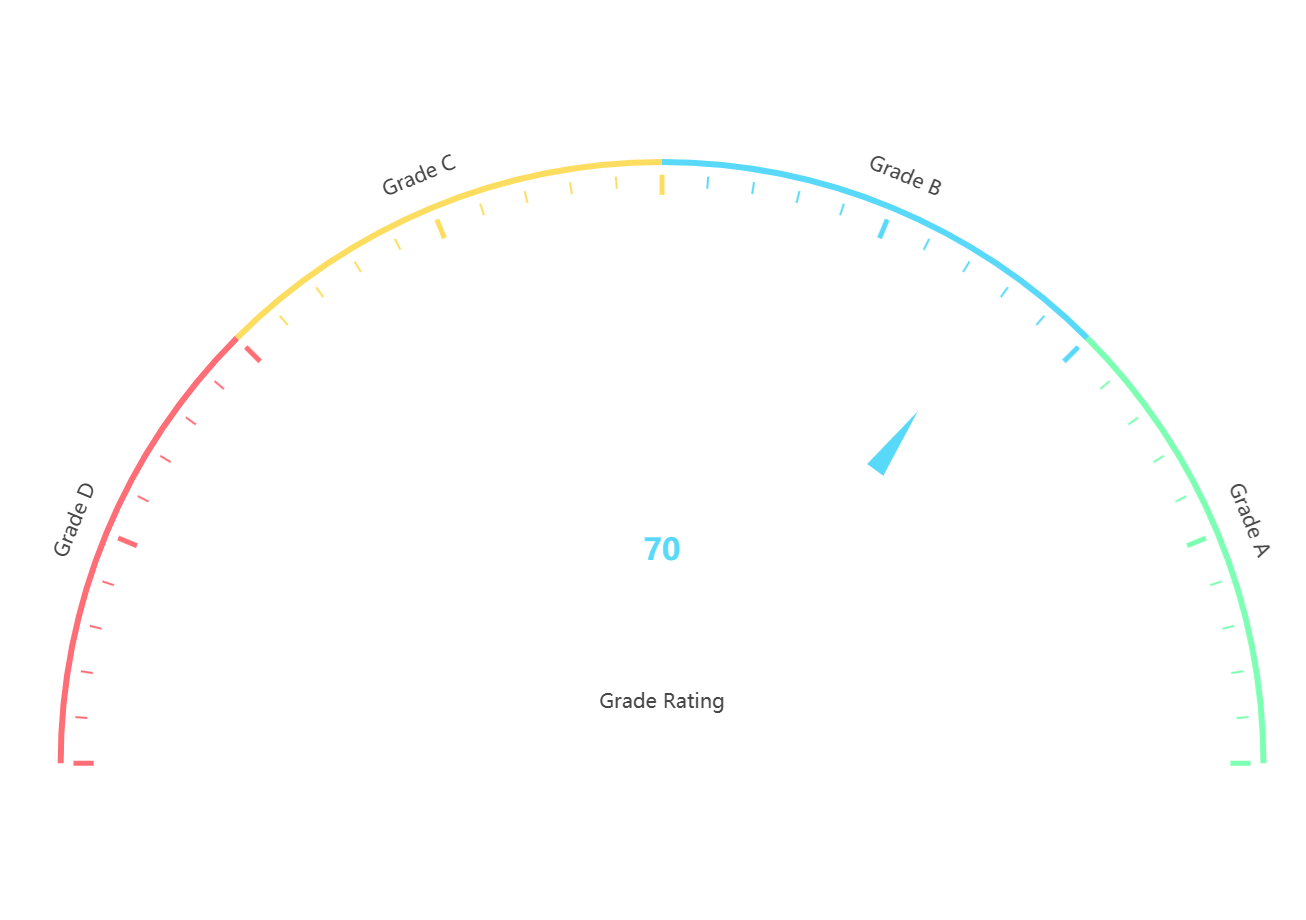
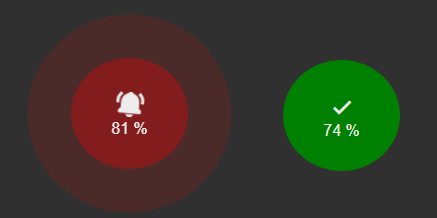
Radial Gauge
Show multiple markers and different ranges on the new Radial Gauge+.

Asset Tree Map
Compare your assets attributes in an ingeractive asset tree map.

Radar Plot
A radar chart displays multivariate data stacked at an axis with the same central point. The chart features three or more quantitative variables for comparison
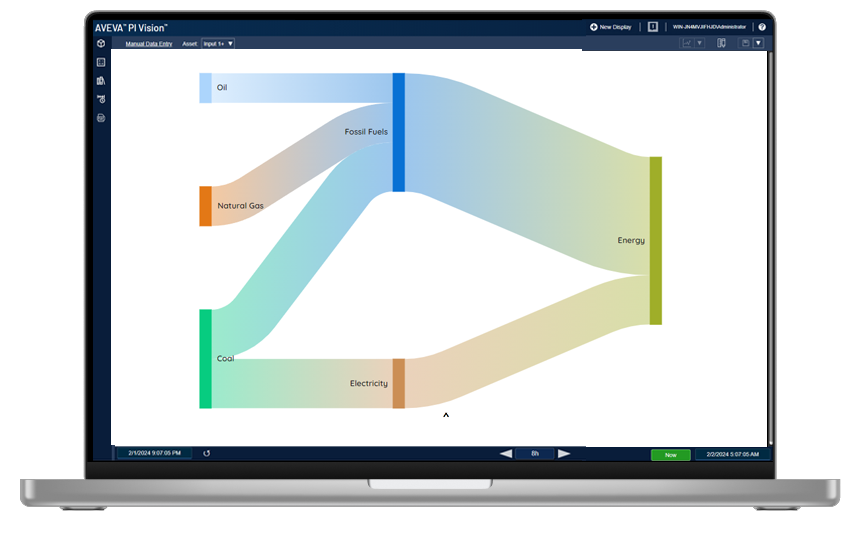
Sankey Diagram
Sankey diagrams are a data visualisation technique or flow diagram that emphasizes flow/movement/change from one state to another or one time to another, in which the width of the arrows is proportional to the flow rate of the depicted extensive property.
Event Frame Chart
Analyse your event frames using the Event Frame Chart+
In Development for existing Symbols
The following enhancements are currently in development for one or multiple of your existing symbols