Gantt Chart+
Gantt Chart+ is a custom symbol for PI Vision that displays event frames in an easy-to-read Gantt chart format. With extensive configuration and grouping options, this tool simplifies event analysis and is included in the Vision Library+ Symbol Collection.
Features
- Extensive Configuration: Filter and display event frames with advanced search and filter options.
- Grouping: Group events by attributes such as asset, name, severity, or custom values.
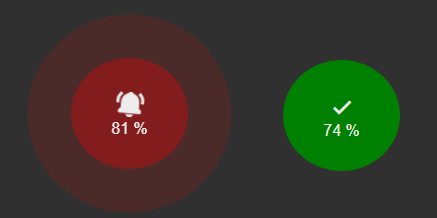
- Multistate Support: Color bars based on severity, asset, or custom attributes for better visualization.
- Tooltips: Display detailed event frame information on hover with fully configurable properties.
- Event Details: Click on an event to view additional information, such as attribute values and annotations.
- Edit Event Frames: Acknowledge, edit, or delete event frames directly within the chart.
Benefits
Gantt Chart+ enhances event visualization in PI Vision, providing clear and customizable insights into event frames.
- Streamlined Analysis: Simplify event data interpretation with visually organized charts.
- Customizable Views: Tailor the chart to fit specific analysis needs.
- Improved Decision-Making: Gain quick insights into event trends and anomalies.
Example Use Cases
- Maintenance Scheduling: Visualize downtime events and plan maintenance schedules effectively.
- Production Tracking: Monitor production events and identify bottlenecks or delays.
- Incident Analysis: Investigate critical events and track their impact over time.
Screenshots

Extensive Configuration
Filter and display event frames with advanced options.

Grouping Events
Group similar events by attributes like asset, name, or severity.

Multistate Visualization
Color bars based on critical metrics for enhanced insights.

Tooltips
View detailed event information by hovering over elements.

Event Details
Click events to see more details, including attributes and annotations.

Edit Event Frames
Acknowledge, edit, or delete event frames with ease.
Demo

Questions?
Click the button below to get in contact, or simply email us at contact@software-athlete.com. We would love to help you.