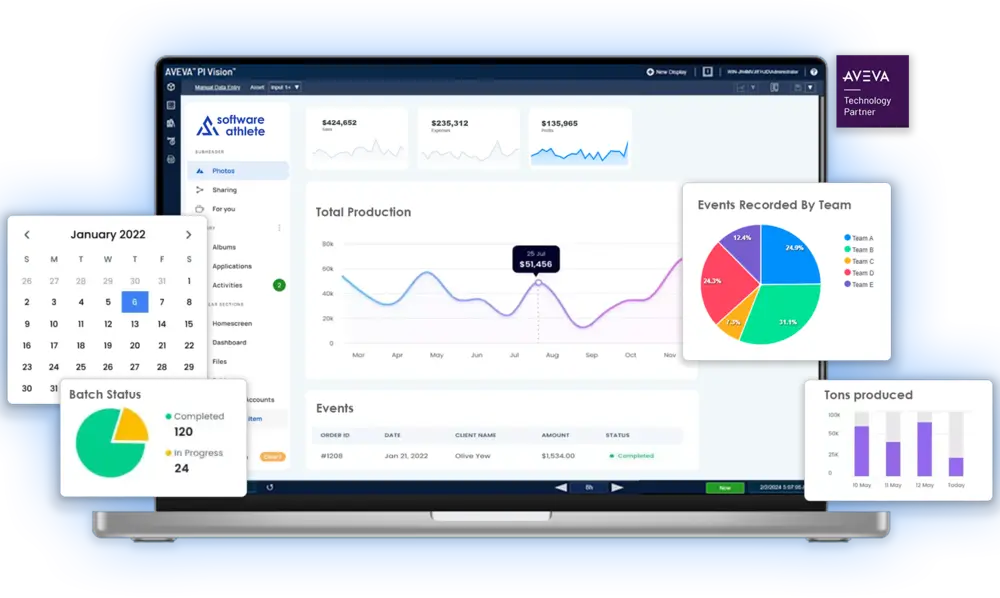
A self-service dashboarding tool for context-driven display, on-the-fly analysis, and secure sharing of your AVEVA PI System data—accessible anywhere on any device.
See how better data visibility improves operations
AVEVA™ PI Vision™ brings operations data to life with configurable visualization and analysis. Get information into the hands of operators, engineers, analysts, and reporting teams across your organization.
Benefits
Gain instant self-service access
Create powerful monitoring displays and reusable dashboards with an intuitive, web-based interface.
Empower your team for immediate problem-solving
Simply drag, drop, and configure analyses of assets and process events in an ad hoc environment tailored to industrial needs.
Ensure the security of your data
Thanks to Windows Active Directory, you can be sure that only the right people have access to your valuable data.
Create consistent views
Build a single display, then reuse it across hundreds of assets and multiple sites.
Features
Real-time notifications
Operators have rapid insights into each of their sites with alarms tied directly into the screens for rapid issue detection.
Context-driven collections
Grouping similar assets allows you to easily filter displays and automatically add new assets.
Multi-stating
Visual status indicators help engineers and operators easily understand the status of their assets at a glance.
Ad-hoc trending
Simplify root cause analysis by multi-selecting data items from any display then send them to an ad hoc workspace.

Customize and Upgrade
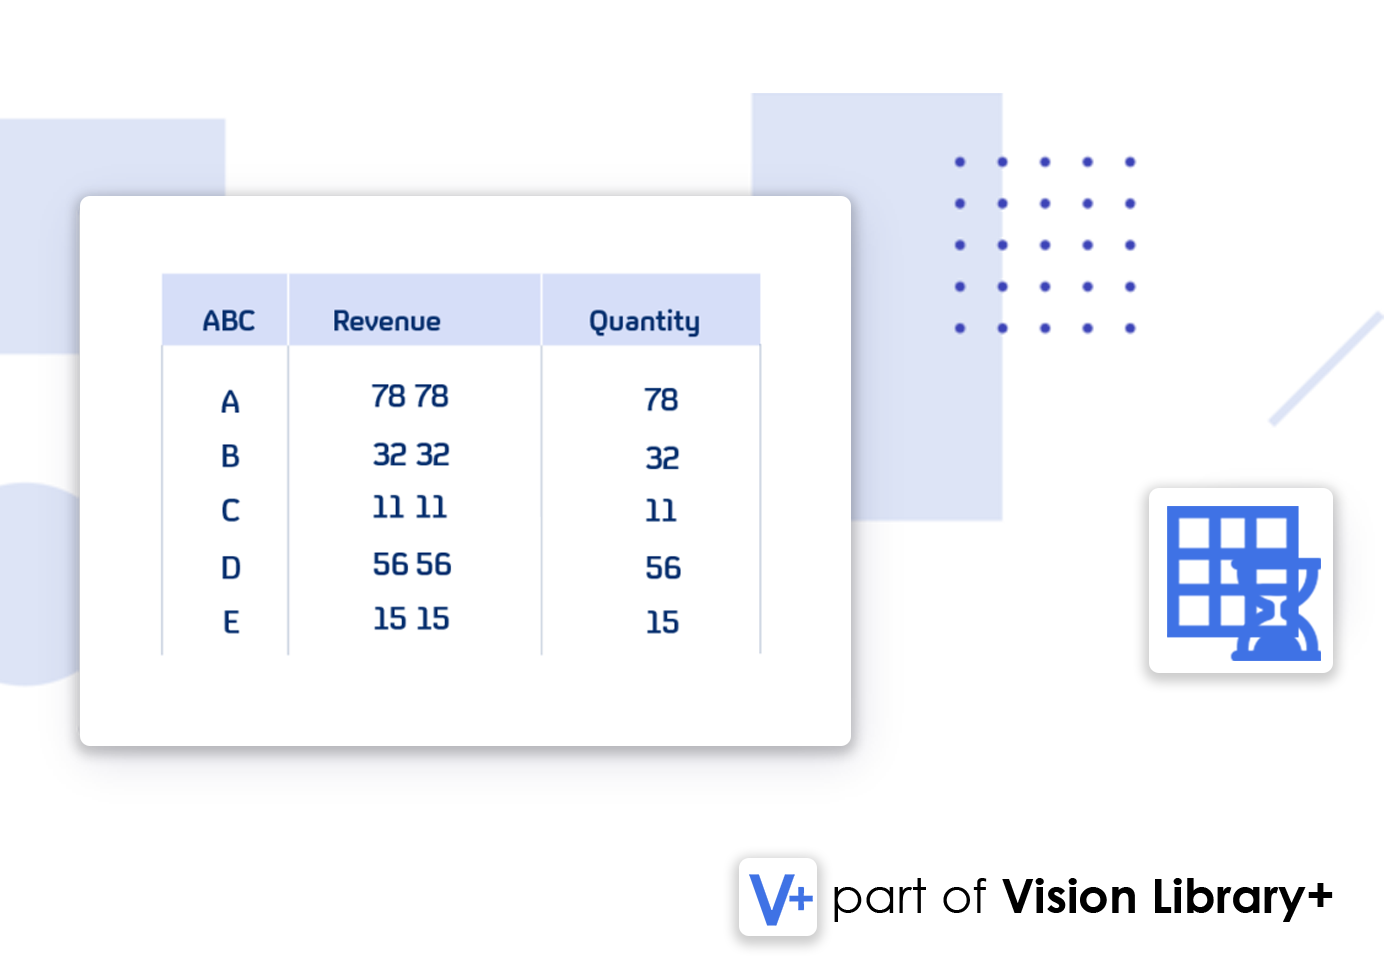
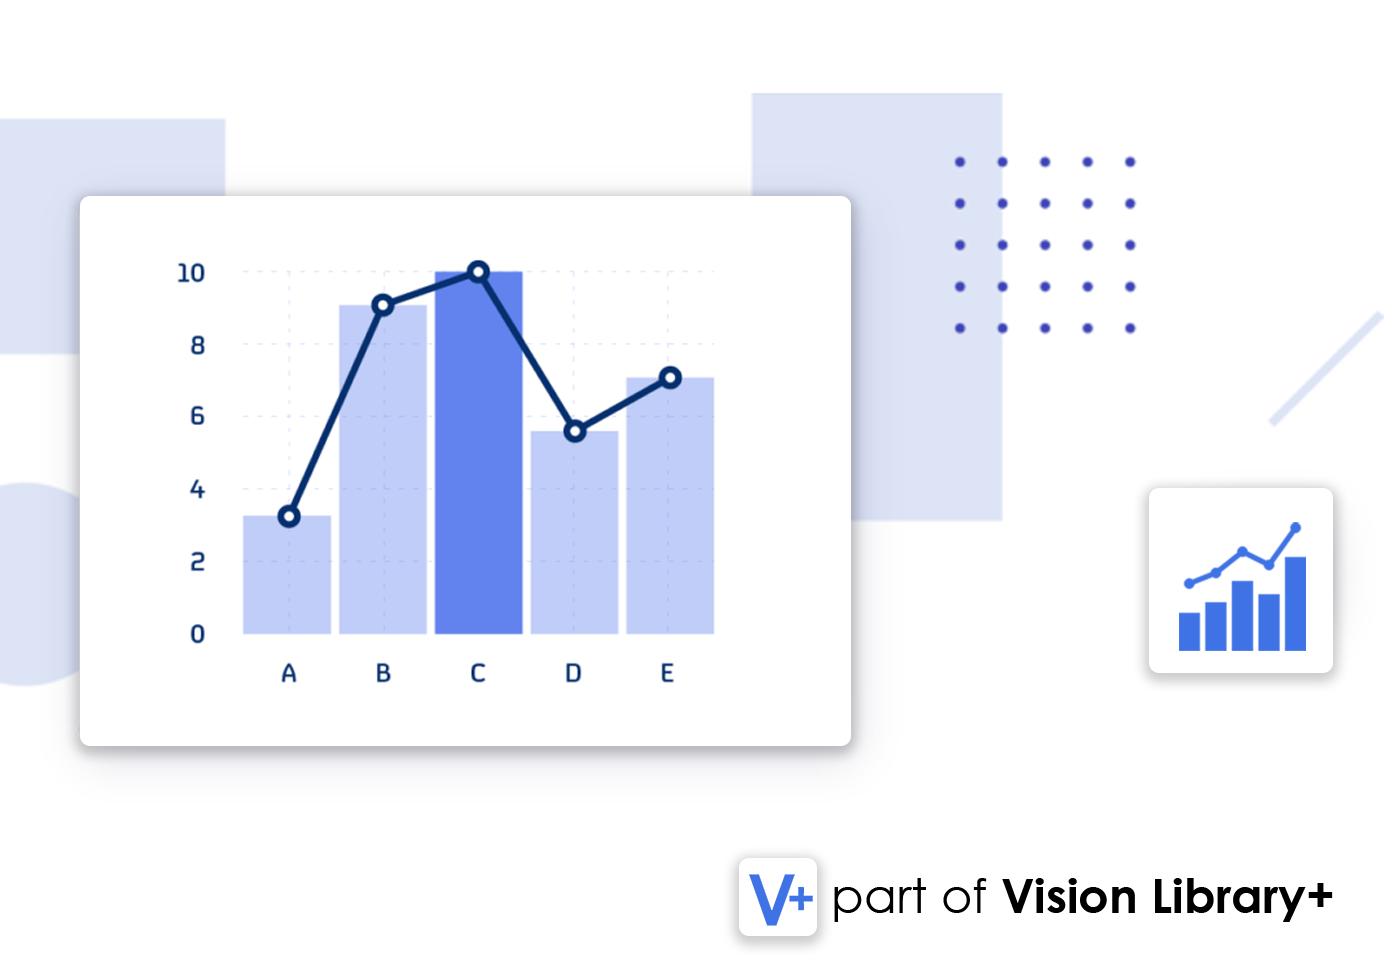
Upgrade PI Vision with a set of custom symbols, like the symbol package Vision Libary+.
PI Vision Extensibility
With PI Vision Custom Symbols, you can enhance PI Vision and add much needed features like data entry or bar charts.


