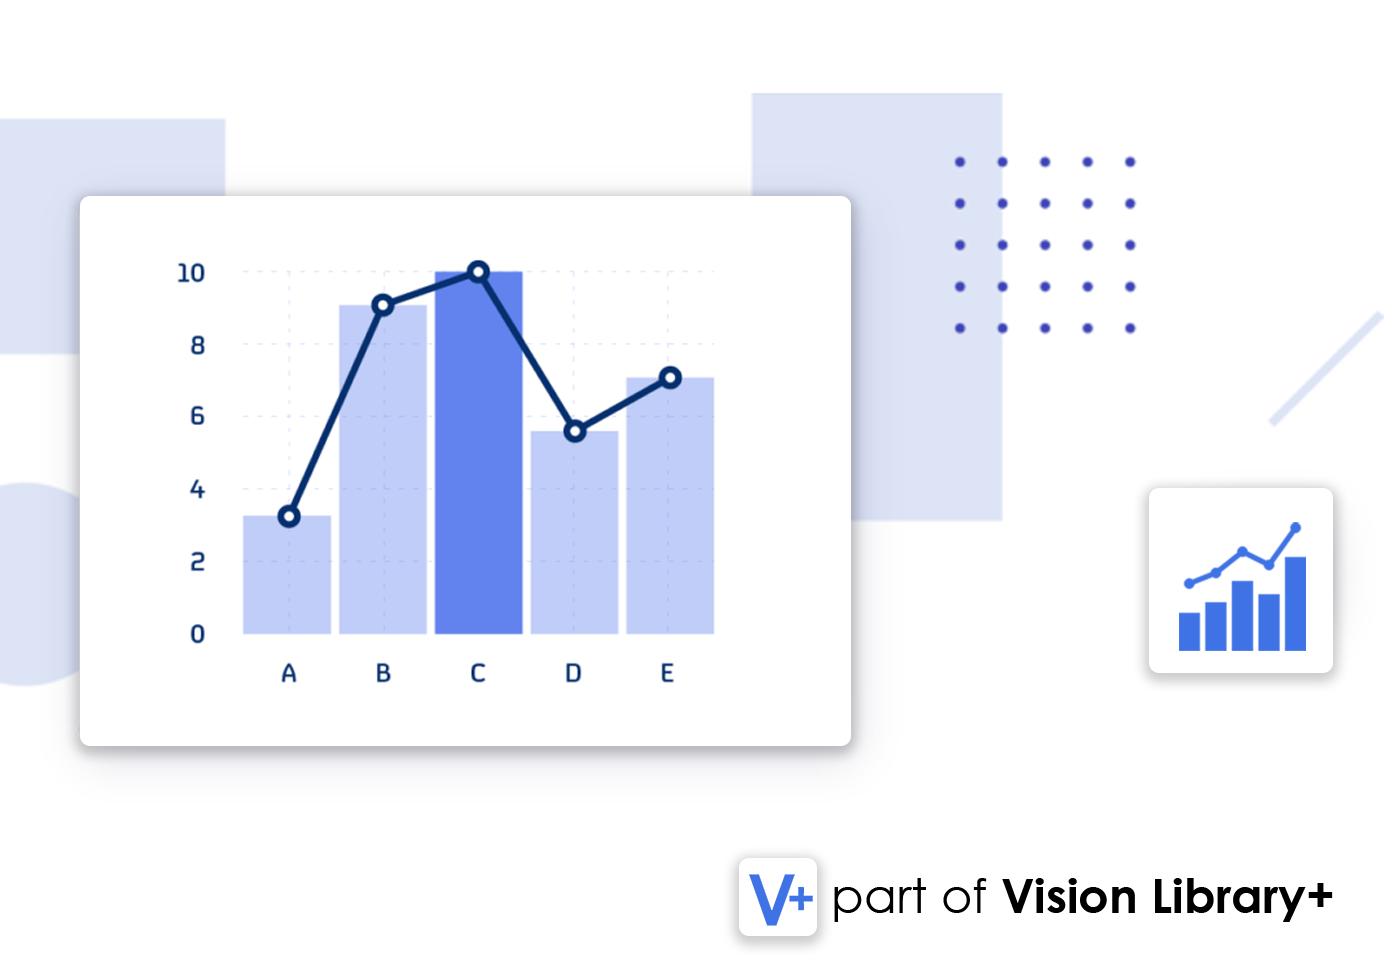
Combo Chart+
The All-In-One Charting Symbol. Combine Lines, Bars, Areas and Scatter Series all in one Chart. Also allows you to use Multistate and Visualize Events directly on the chart.
Asset Comparison Bar Chart+
Dynamically compare multiple assets at once, in a fully customizable bar chart.
Gantt Chart+
Visualize Event Frames in a modern an sleek Gantt Chart. Extensive Configuration, Full Multistate support. Edit, Acknowledge or Delete Event Frames.
Manual Data Entry+
Finally you are able to enter data into PI directly within PI Vision. Supports all Datatypes, Multistate, Editing and Deleting Data, as well as User Logging.
Manual Input Table+
Finally you are able to enter data into PI directly within PI Vision. Supports all Datatypes, Multistate, Editing and Deleting Data, as well as User Logging.
Quick Input+
One-click values in PI. This symbol makes manipulating PI and AF Data a breeze.
Time Series Table+
Visualize Time Series Data directly in PI vision, without having to use PI DataLink. Supports Multistate for all Datatypes, Filtering, Exporting and much more.
AF Table+
Visualize SQL Tables, Files or other Data Sources directly in PI Vision. Supports Multistating, Filtering, Sorting and more.
Events Table+
The more advanced events table for PI Vision. Grouping, filtering, sorting, adding comments, downloading and more!
Heatmap+
A 2-dimensional data visualization technique that represents the magnitude of individual values within a dataset as a color
Waterfall Chart+
Track asset effectiveness, line productivities, yields or more with the interactive waterfall chart
Navigation Menu+
Create beautiful and easy to navigate PI Vision Displays with this symbol. Create Links and Sub-Menus, change colors and add your own logo.