![]()
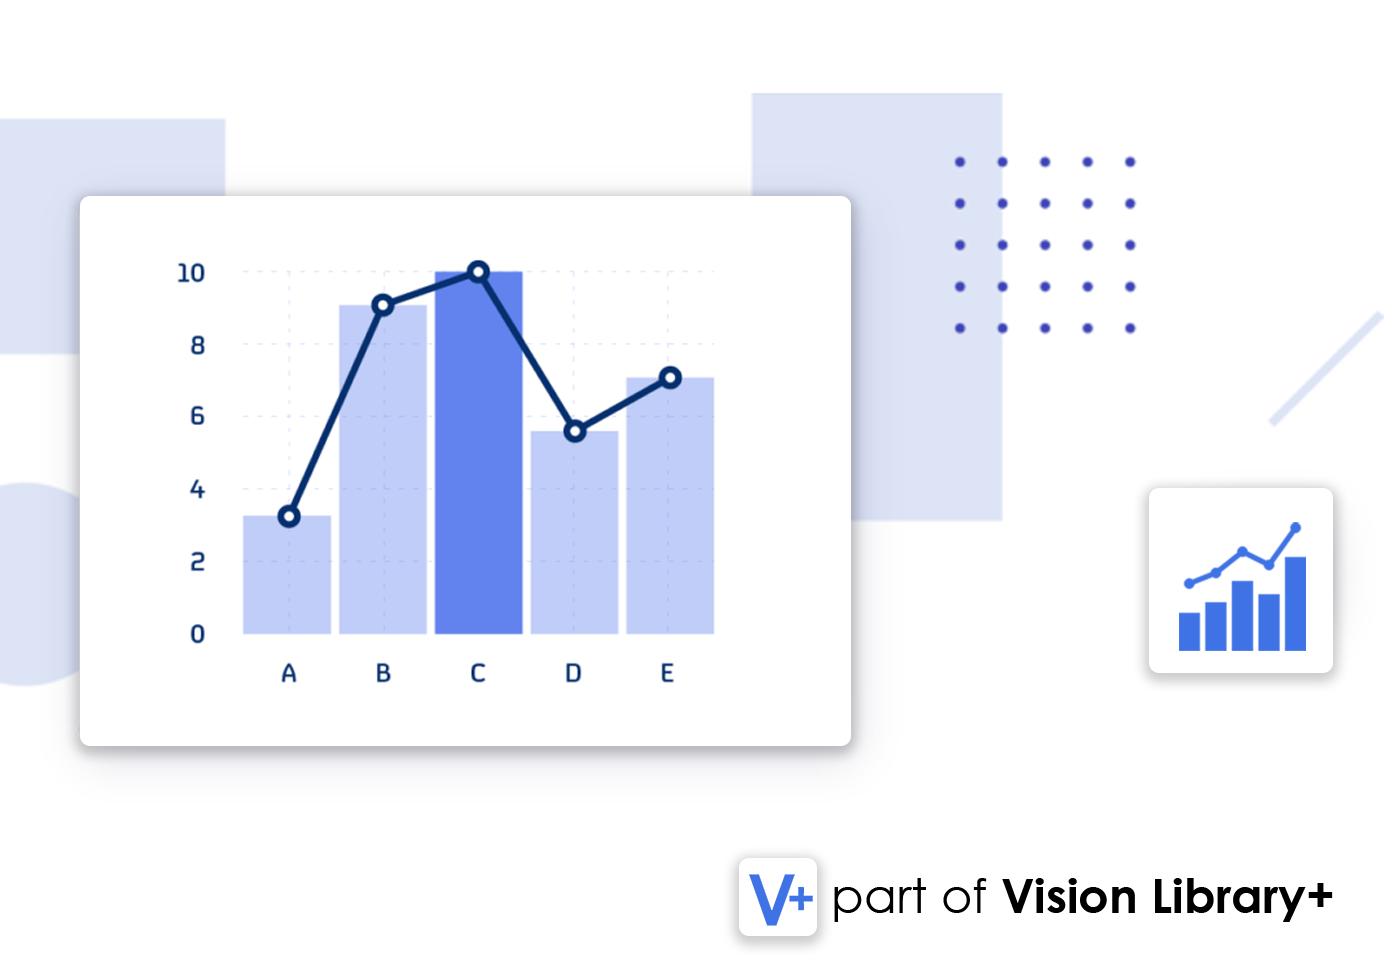
Histogram+
Histogram+ is a custom symbol for PI Vision that displays data from PI Tags, AF Attributes, and calculations, counting their relative occurrences. This symbol is part of the Vision Library+ Symbol Package.
Features
- Supports All Data Types: Compatible with numbers, strings, booleans, and enumeration values.
- Multistate Visualization: Color bars or display limits based on your multistate configuration.
- Download Data: Export data to CSV or JSON files for further analysis.
- Percentiles: Display percentiles (e.g., P90) directly within the chart.
Benefits
Histogram+ simplifies data analysis by providing an intuitive view of data distributions and relative occurrences.
- Data Clarity: Visualize data distributions with an easy-to-understand chart.
- Flexible Export Options: Export data to analyze further in your preferred tools.
- Enhanced Insights: Highlight critical data points with percentiles and multistate options.
Example Use Cases
- Quality Control: Analyze production data distributions to identify variability or outliers.
- Performance Monitoring: Track system performance by evaluating data distributions over time.
- Statistical Analysis: Use percentiles to understand key thresholds in your data.
Screenshots

Supports All Data Types
Works with numbers, strings, booleans, and enumeration values.

Multistate Visualization
Color-code bars or show limits based on configuration.

Download Data
Export data to CSV or JSON files for external analysis.

Statistics
Show multiple standard deviations and bell curve distribution
Demo

Questions?
Click the button below to get in contact, or simply email us at contact@software-athlete.com. We would love to help you.