Blog
Discover new ideas and possibilites.

How to Enter Manual Data into the PI System Using PI Vision
The PI System is a powerful data management tool widely used for real-time data collection and analysis. PI Vision, a...

Migrate from Processbook to PI Vision: How "Vision Library+" can help your company make the move
As AVEVA Processbook approaches its end-of-support deadline at the end of 2024, companies relying on its robust capabilities for process...

Convert PI Vision to PDF with Vision Report+
Overview Vision Report+ significantly upgrades how companies manage and report data within the PI system. This tool simplifies the process...

Play Sounds in PI Vision with Alarm Sound+
In the world of operational management, staying ahead of process changes is crucial. The new Alarm Sound+ (as part of Vision...

Create SPC and SQC Charts in PI Vision with Vision Library+
Introduction Statistical Process Control (SPC) and Statistical Quality Control (SQC) are methodologies used to monitor, control, and ensure the quality...

Quick Input+: Revolutionizing Data Input in PI Vision
"Quick Input+" is a dynamic and versatile custom symbol extension designed specifically for PI Vision, the leading visualization tool...

How Gantt Chart+ improves Production Event Visualization in PI Vision
In the intricate landscape of industrial production, especially within sectors such as energy, mining, chemicals, and pharmaceuticals, the capability...

AVEVA PI Vision Heatmaps: Unraveling Complex Process Data in the Energy Industry
What is a Heatmap? A heatmap is a powerful data visualization tool that leverages a color-coded matrix to represent individual...

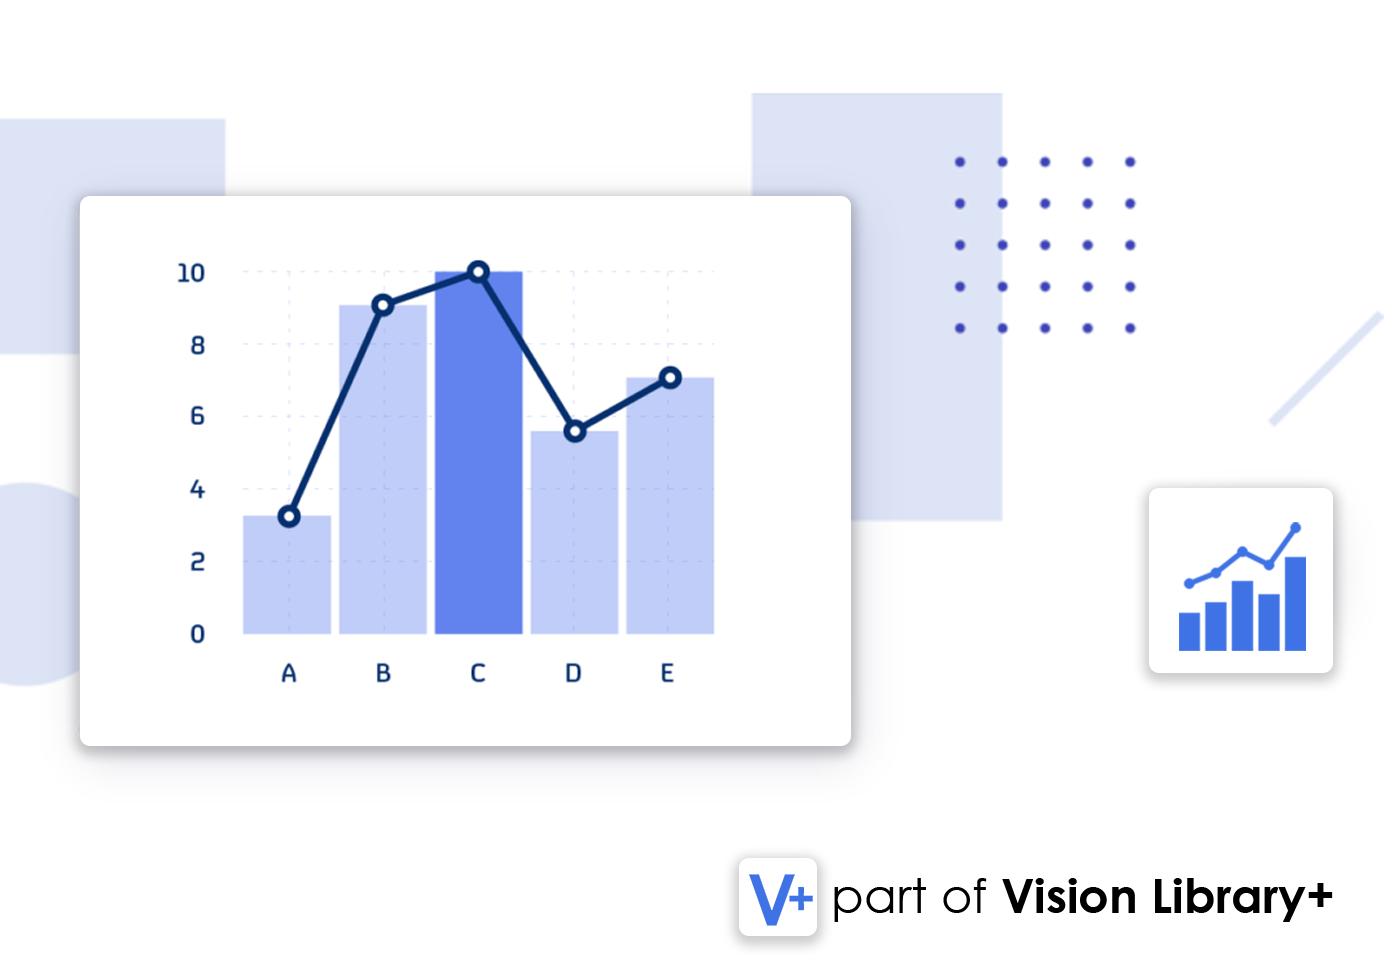
Combo Charts in AVEVA PI Vision: Powerful Visualizations for Industrial Applications
Unveiling Trends and Outliers in Energy, Mining, and Chemical Industries The combo chart, a versatile visualization tool in AVEVA...